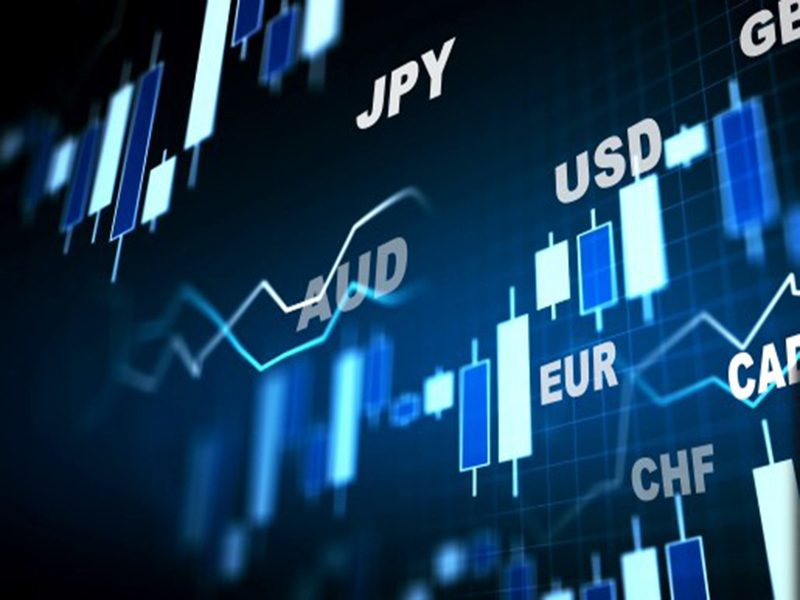
One of the several terms to understand when playing in the financial market is technical analysis. Another like it is the fundamental analysis.
As it is important to have a knowledge of what you are going into when investing in the financial market (forex, crypto, and stocks), technical analysis is one term you’ll to know about it.
In this post, we’ll learn about technical analysis especially in regards to the forex market.
What is Technical Analysis?
Technical analysis is the framework in which traders study price movement. The theory is that a person can look at historical price movements and determine the current trading conditions and potential price movement.
Someone who uses technical analysis is called a technical analyst while traders who use technical analysis are known as technical traders.
The main evidence for using technical analysis is that, theoretically, all current market information is reflected in the price.
Technical traders generally ascribe to the belief that “It’s all in the charts!”
This simply means that all known fundamental information is priced into the current market price. This type of analysis looks at the rhythm, flow, and trends in price action.
What is Technical Analysis About?
If a certain price held as a major support or resistance level in the past, forex traders will keep an eye out for it and base their trades around that historical price level.
Technical analysts look for similar patterns that have formed in the past and will form trade ideas believing that price could possibly act the same way that it did before.
Technical analysis is NOT so much about prediction as it is about POSSIBILITY. It is the study of historical price action in order to identify patterns and determine possibilities of the future direction of price.

Understanding Technical Analysis
Technical analysis is the study of historical price action in order to identify patterns and determine probabilities of future movements in the market through the use of technical studies, indicators, and other analysis tools.
This type of analysis boils down to two things:
- identifying trend
- identifying support/resistance through the use of price charts and/or timeframes
Markets can only do three things: move up, down, or sideways.
Prices typically move in a zigzag fashion, and as a result, price action has only two states:
Range – when prices zigzag sideways
Trend – prices either zigzag higher (up trend, or bull trend), or prices zigzag lower (down trend, or bear trend).
Why is Technical Analysis important?
The analysis of a market can help you determine not only when and where to enter a market, but much more importantly, when and where to get out.
How can you use Technical Analysis?
It is based on the theory that the markets are chaotic (no one knows for sure what will happen next), but at the same time, price action is not completely random. In other words, mathematical Chaos Theory proves that within a state of chaos there are identifiable patterns that tend to repeat.
This type of chaotic behavior is observed in nature in the form of weather forecasts. For example, most traders will admit that there are no certainties when it comes to predicting exact price movements. As a result, successful trading is not about being right or wrong: it’s all about determining probabilities and taking trades when the odds are in your favor. Part of determining probabilities involves forecasting market direction and when/where to enter into a position, but equally important is determining your risk-to-reward ratio.
Conclusion
Remember, there is no magical combination of technical indicators that will unlock some sort of secret trading strategy. The secret of successful trading is good risk management, discipline, and the ability to control your emotions. Anyone can guess right and win every once in a while, but without risk management, it is virtually impossible to remain profitable over time.


