


EUR/USD came under renewed bearish pressure and declined toward 1.1000 in the early American session. Despite the weak US GDP growth recorded in the first quarter, strong inflation and spending numbers in the report seem to be providing a boost to the USD.

The daily chart for the EUR/USD pair retains a neutral-to-bullish stance. The pair holds well above bullish moving averages, with the 20 Simple Moving Average (SMA) providing dynamic support at around 1.0955.
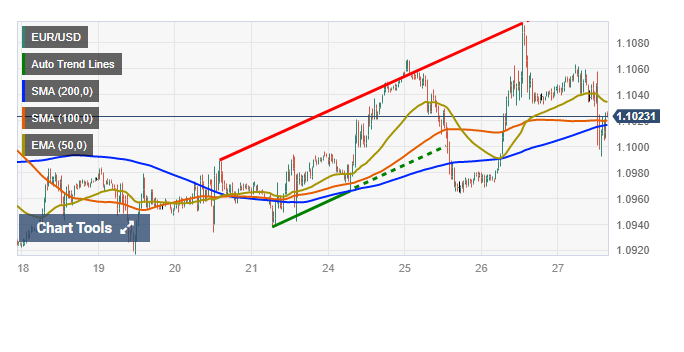
The longer moving averages keep heading north below it, while technical indicators head nowhere above their midlines. Overall, bulls hold the grip in the longer-term perspective.
In the near term, and according to the 4-hour chart, the risk skewed to the downside. The pair is currently crossing a mildly bullish 20 SMA, while the longer ones lose their upward strength far below the current level. Technical indicators, on the other hand, head firmly lower, the Momentum within negative levels and the RSI currently challenging its 50 level.
Still, chances of a continued decline are pretty limited, as the pair would need to fall through 1.0900 to start discouraging buyers.
Support levels: 1.0990 1.0955 1.0910
Resistance levels: 1.1075 1.1120 1.1165
Read– Common Terms You Need to Know as a Beginner


