

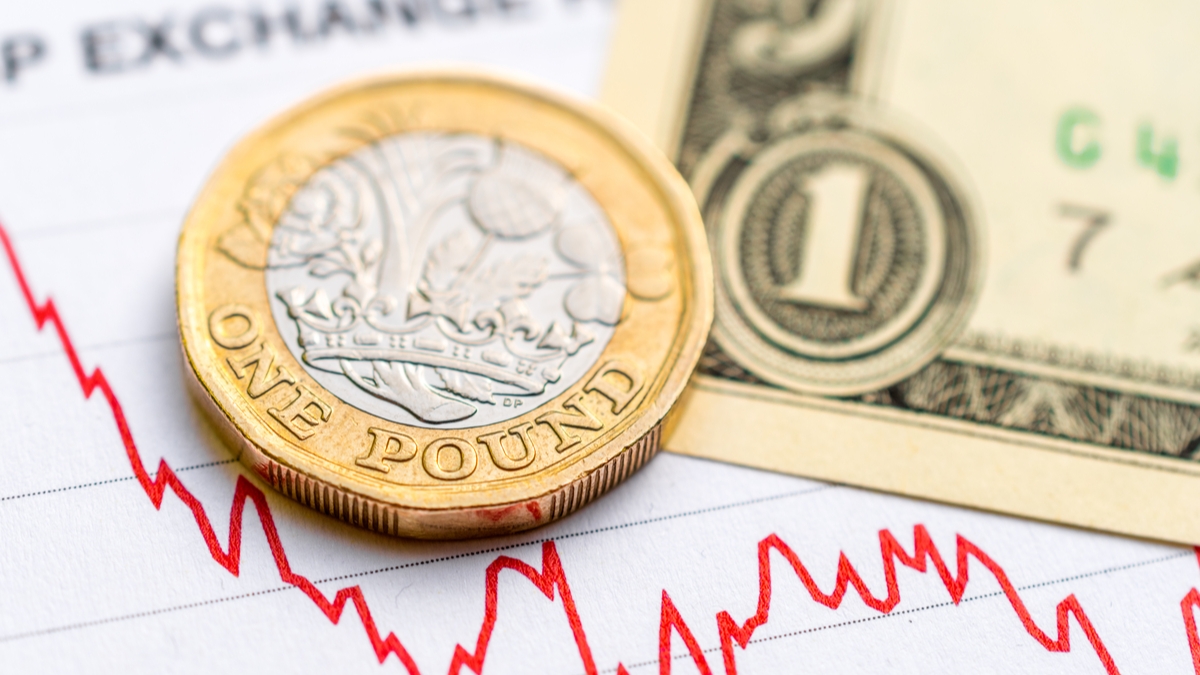

The GBP/USD pair has declined toward 1.1600 with the initial reaction to US CPI data. The pair continues to trade above the one-week-old ascending trend line.

The Relative Strength Index (RSI) indicator on the four-hour chart holds above 60, showing that the bullish bias stays intact in the short term. Moreover, the pair closed the last seven four-hour candles above the 100-period SMA.
Related- GBP/USD Extends Gains above 1.1800
On the upside, the pair faces immediate resistance at 1.1730, where the Fibonacci 38.2% retracement of the latest downtrend is located. In case the pair rises above that level and starts using it as support, it could target 1.1800 (psychological level) and 1.1830 (Fibonacci 50% retracement).
Initial support is located at 1.1700 (psychological level) before 1.1650 (ascending trend line, 100-period SMA) and 1.1600 (psychological level, Fibonacci 23.6% retracement).


